
How to read AI agent comparisons: what the metrics and “five percent” mean
Every week a comparison comes out: agent A is five percent better than agent B. The headline sounds decisive, but that number almost never says what you imagine under it. Sometimes it is five percentage points on five hundred tasks. Sometimes four tasks out of eighty-nine. And sometimes the difference was not created by the model but by a different test environment or a bigger compute budget.
Three things worth knowing
- 1The score belongs to the whole system, not the model. The test harness also matters — the way the agent is launched, which tools it gets and how the result is graded.
- 2“5 % better” can mean three different things: a relative increase, five percentage points, or a quarter reduction of the remaining errors.
- 3On a small set, five points can be noise. On the same set it also matters which tasks each agent won — two averages alone don’t determine significance.

What is actually being compared
In short, almost never “model A versus model B”. What is compared is an agentic system: a language model wrapped in a loop that reads the brief, calls tools, corrects itself based on errors and finally delivers an output. The same model in a different program wrapper gets a different score. That is why it makes sense to talk about an agent, not a chat window.
The number on the leaderboard is the result of five layers. When a launch post states only one of them, the remaining four can change the result significantly. A launch post is the vendor’s announcement when introducing a new model or product.
The first working rule follows from this: a number without the benchmark variant, harness, number of runs and budget is not a comparison. It is just a marketing excerpt. Two rows “Claude 91 %” and “GPT 86 %” can describe different tests, different wrappers and different prices.
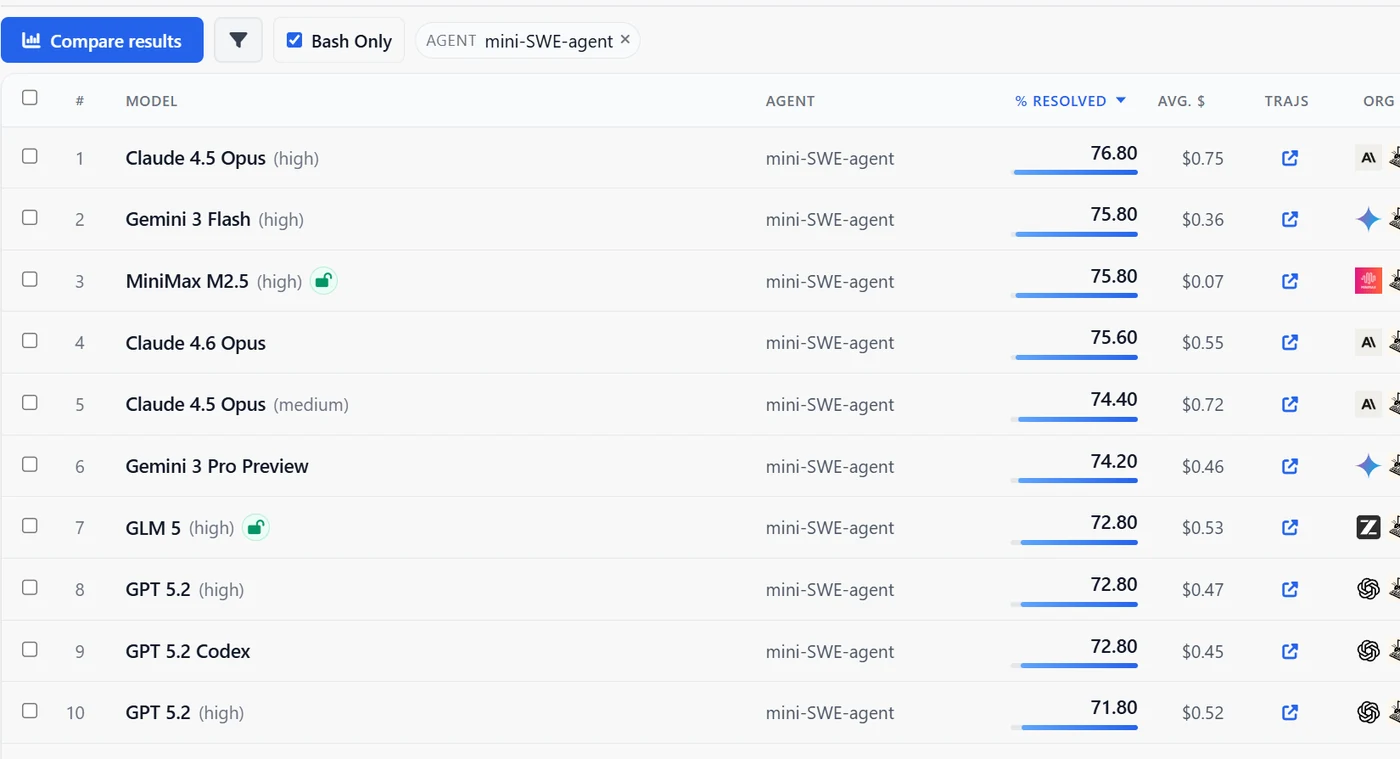
What this looks like live is shown by the default view of SWE-bench Verified. Same harness, different models — and right next to it the resolve rate and the average cost.
Glossary of metrics: what each number measures
Agent leaderboards borrow vocabulary from code generation, dialogue agents and human arenas. The names sound similar, but they ask different questions. Before you start adding up percentages, you need to know which question is on the table.
Resolve / success rate
The share of tasks the agent completed according to the rules of the given test. On SWE-bench it means the code change passes the required tests and doesn’t break those that already worked. On τ-bench the final state of the database is compared with the target. The metric doesn’t say whether the code is well written or whether it would pass human review. The program that automatically checks the result is called the evaluator.
successes / number of tasks
pass@k
The probability that at least one of k independent attempts passes. It comes from HumanEval (Chen et al., 2021). It measures the ceiling of ability when you have a verifier and may pick the best sample. As k grows it rises towards one.
1 − (1 − p)k
pass^k (pass-hat-k)
The probability that all k attempts pass. τ-bench (Yao et al., 2024) introduced it as a reliability metric. In production you don’t care whether the agent can do the task once, but whether it can do it every time. As k grows it falls towards zero.
pk
Length of manageable task (time horizon)
How long a task takes a human that the agent still handles with 50% success. METR uses it because one percent on a mixed set hides whether you can do a one-minute fix or an hour of work. It converts difficulty into human time — not the time the agent ran.
task length at P(success) = 0.5
Elo / arena
Relative strength from pairwise duels where a human votes. It measures preference, not correctness. Good for looks, UX and “I’d like to work with this”. Not suitable as proof that the agent fixed a bug.
Bradley–Terry / Elo from win rate
Price and number of turns
How many tokens, dollars and minutes one resolution costs. Two extra points at triple the price are not automatically a better product. What can be seriously compared is the cost per success and the price of every additional task the more expensive agent solves on top.
$ / solved task
A few more terms belong here that appear in tables without explanation. Fail-to-pass tests fail before the fix and should pass after it — that is exactly how it is shown that the agent fixed the problem. Pass-to-pass tests worked before the change and the agent must not break them. Coverage says whether the system produced the correct answer among the generated options at all. Selector accuracy then measures whether it was able to pick it. High coverage without good selection is not enough in practice — we break this down under reasoning models.
For tool-using agents, step success (success of a single step) is sometimes listed alongside task success (success of the whole task). An agent may correctly perform most individual tool calls and still fail to complete the order because it breaks a rule or misunderstands the user. For overall comparison, task success is more important; step success helps find the cause of an error.
| Metric | Question | Rises when | Typical trap |
|---|---|---|---|
| Resolve / success | Did it solve the task by the test’s rules? | More tasks pass the evaluator | Automatic test ≠ human review or production |
| pass@k | Can it do it at least once in k attempts? | You can produce multiple attempts and verify them | Looks better than one-shot operation |
| pass^k | Can it do it every time in k attempts? | Instability decreases | Looks strict; that is the intention |
| Time horizon | How long a piece of human work can it still manage? | Handles longer, less atomic tasks | Depends on what you count as success |
| Elo / arena | Do people prefer it in a pair? | Seems more useful or more pleasant | Preference is not correctness |
| Cost per success | How much does one resolution cost? | Same score for less money / fewer turns | Often missing from the headline score |
What it means that one agent is 5 % better
This is the most common sentence in announcements — and at the same time the worst defined. “Five percent better” can be read in at least three ways. Until you know which one the author used, you are comparing apples with pears.
From 80 % to 84 %. Marketing loves this because it makes “plus five” out of any base. At a score of 96 % the same calculation would lead to an impossible 100.8 %. Relative growth is therefore misleading for metrics capped at one hundred.
From 80 % to 85 %. That is the decent language of evaluations. On SWE-bench Verified (500 tasks) it is 25 extra resolved issues. On Terminal-Bench (89 tasks) it is four tasks.
From 80 % to 85 % is only five points, but the error rate dropped from 20 % to 15 % — by a quarter. Near the ceiling this is exactly what matters: the last errors tend to be the hardest.
The practical translation is always the number of tasks, not the percentage. Five points on 500 tasks is 25 fixes. Five points on 89 tasks is four fixes. Five points on 12 tasks in a company demo set is less than one task. Such a percentage makes no sense on its own.
Also, 25 additionally solved tasks can have different value. If agent B mainly solves tasks that agent A almost managed already, it mainly improved the score. If, on the other hand, it solves a type of task on which A regularly fails, it added a new capability. The leaderboard won’t show this difference unless you see results by repository, language or bug type.
Mini-calculation: five points and the invoice
Agent A solves 80 % of tasks at $1.20 per task. Agent B solves 85 % at $4.80. On 500 tasks B adds 25 successes and swallows $1,800 more. One additional success thus costs $72. If that success saves you an hour of a senior’s work, it pays off. If it saves you three minutes on a trivial test, it is an expensive average.
The same logic is drawn by the official Pareto view of Terminal-Bench: the Y axis is success rate, the X axis total cost. The most interesting points are those high up and at the same time as far left as possible: high success at low cost. The point at top right can do more, but also costs more.

The last thing forgotten about “plus five”: transfer. Five points on Python issues from twelve public repositories is not five points on your C# monorepo with internal libraries and no public tests. A benchmark is a filter, not a prediction of productivity. When choosing a tool for a team, your own set of tasks decides — we return to that at the end.
Set size and statistical noise
You compute the success rate as the number of solved tasks divided by the set size. In the notation below, n is the number of tasks and p the measured success rate. The smaller n is, the more easily one lucky or unlucky task affects the result. Statistically such a proportion has variance p(1 − p) / n.
A confidence interval shows the reasonable range of values compatible with the observed result. Below we use the 95% Wilson interval: unlike the simple ± 1.96 × SE it behaves more sensibly on small sets and near 0 or 100 %. It is still the interval of a single score, not an automatic test of the difference between two agents.
80 % versus 75 % is not enough
Agent A solved 400 and agent B 375 of the same 500 tasks. In both examples the difference is five points. Only which tasks they solved changes. The exact McNemar test works precisely with the discordant pairs: “only A” against “only B”. The displayed p-value says how surprisingly uneven such a result would be if both agents were equally successful. A value below 0.05 is commonly considered statistically significant. It does not say, however, whether the difference is large enough or useful in practice.
Same errors, clear shift for A
p < 0.000001
All 25 disagreements go in A’s favour. B adds no win of its own.
Different errors, weaker evidence
p ≈ 0.069
A leads 100 to 75, but the agents have many different wins. At the usual 5% level the difference is not yet significant.
In practice: publish the task IDs from the results, not just the sum. With multiple repeated runs, use a paired bootstrap — the computer repeatedly creates new samples from the same results and watches whether the difference holds. For SWE-bench it is even more honest to form these samples by whole repositories, because tasks from the same project may be similar.
Near the ceiling the binomial variance p(1 − p) is smaller than in the middle of the scale, so the interval of a single score tends to be narrower. But that is not a licence to compare two overlapping sets as independent. Statistical proof belongs to paired results; practical value belongs to the specific fixed bugs. The last errors, moreover, tend to be badly specified, ambiguous or require longer planning.
Two runs of the same agent are also not identical. Generation temperature (degree of randomness), tool order, timeout and chance in action selection can shift the result by a few points. A serious report therefore states the average of several runs with different seeds (initial random settings) and also the variance of the results. A single maximum picked from the most successful run is a lucky exception, not typical performance.
When an author compares twenty metrics and publishes only the one where they won by five points, they are cherry-picking — selecting the result that suits them. With twenty independent tests at the 5 % level you expect one “win” even when the difference is zero. So ask for the primary metric set in advance, not the prettiest column in the table.
Optional: compute the examples in Python
The following script computes Wilson intervals, the exact McNemar test for both overlaps and both pass metrics.
import math

def wilson95(p, n, z=1.96):
    """95% Wilsonův interval pro jeden binomický podíl."""
    d = 1 + z**2 / n
    stred = (p + z**2 / (2 * n)) / d
    pulka = z * math.sqrt(p * (1 - p) / n + z**2 / (4 * n**2)) / d
    return stred - pulka, stred + pulka

def mcnemar_exact(jen_a, jen_b):
    """Přesný oboustranný McNemarův test nad neshodnými páry."""
    n = jen_a + jen_b
    mensi = min(jen_a, jen_b)
    jednostranny = sum(math.comb(n, i) for i in range(mensi + 1)) / 2**n
    return min(1, 2 * jednostranny)

# Nejistota jednoho skóre:
for nazev, p, n in [
    ("SWE-bench Verified", 0.80, 500),
    ("Terminal-Bench", 0.70, 89),
    ("AIME", 0.80, 30),
]:
    lo, hi = wilson95(p, n)
    print(nazev, f"{100 * lo:.1f}–{100 * hi:.1f} %")

# Stejných 80 % vs. 75 %, ale jiný překryv úspěchů:
print("podobné chyby:", mcnemar_exact(jen_a=25, jen_b=0))
print("odlišné chyby:", mcnemar_exact(jen_a=100, jen_b=75))

p, k = 0.80, 5
print("pass@5 při p=0.80 =", round(1 - (1 - p) ** k, 3))
print("pass^5 při p=0.80 =", round(p ** k, 3))
pass@k versus pass^k: ceiling and floor
These two notations differ by one symbol and a whole philosophy. pass@k asks: can the agent ever do the task? pass^k asks: can it do it every time? With a single-attempt success rate of p = 80 % and k = 5, a large difference emerges that a single headline score hides.
pass@5 · ceiling of ability
One success in five is enough. At p = 0.80 it is 1 − 0.205 ≈ 99.97 %. The agent “can do” almost everything — if you can produce multiple attempts and have a reliable test that picks the correct result.
Where you meet it HumanEval and HumanEval+ (Chen et al., EvalPlus), MBPP and LiveCodeBench. Most often pass@1 is stated, in model cards also pass@10 / pass@100.
pass^5 · floor of reliability
All five attempts must pass. At p = 0.80 it is 0.805 ≈ 32.8 %. The same agent is suddenly reliable on only a third of tasks. That is a number closer to a nightly batch without a human in the loop.
Where you meet it τ-bench, τ²-bench and τ³-bench (Yao et al. / Sierra). The main result is the curve pass^1 → pass^4 → pass^8, not a single number.

pass@5 ≈ 99.97 % and the floor pass^5 ≈ 32.8 %. The greyed area is the difference the headline score hides. It is a formula, not a leaderboard of a specific model.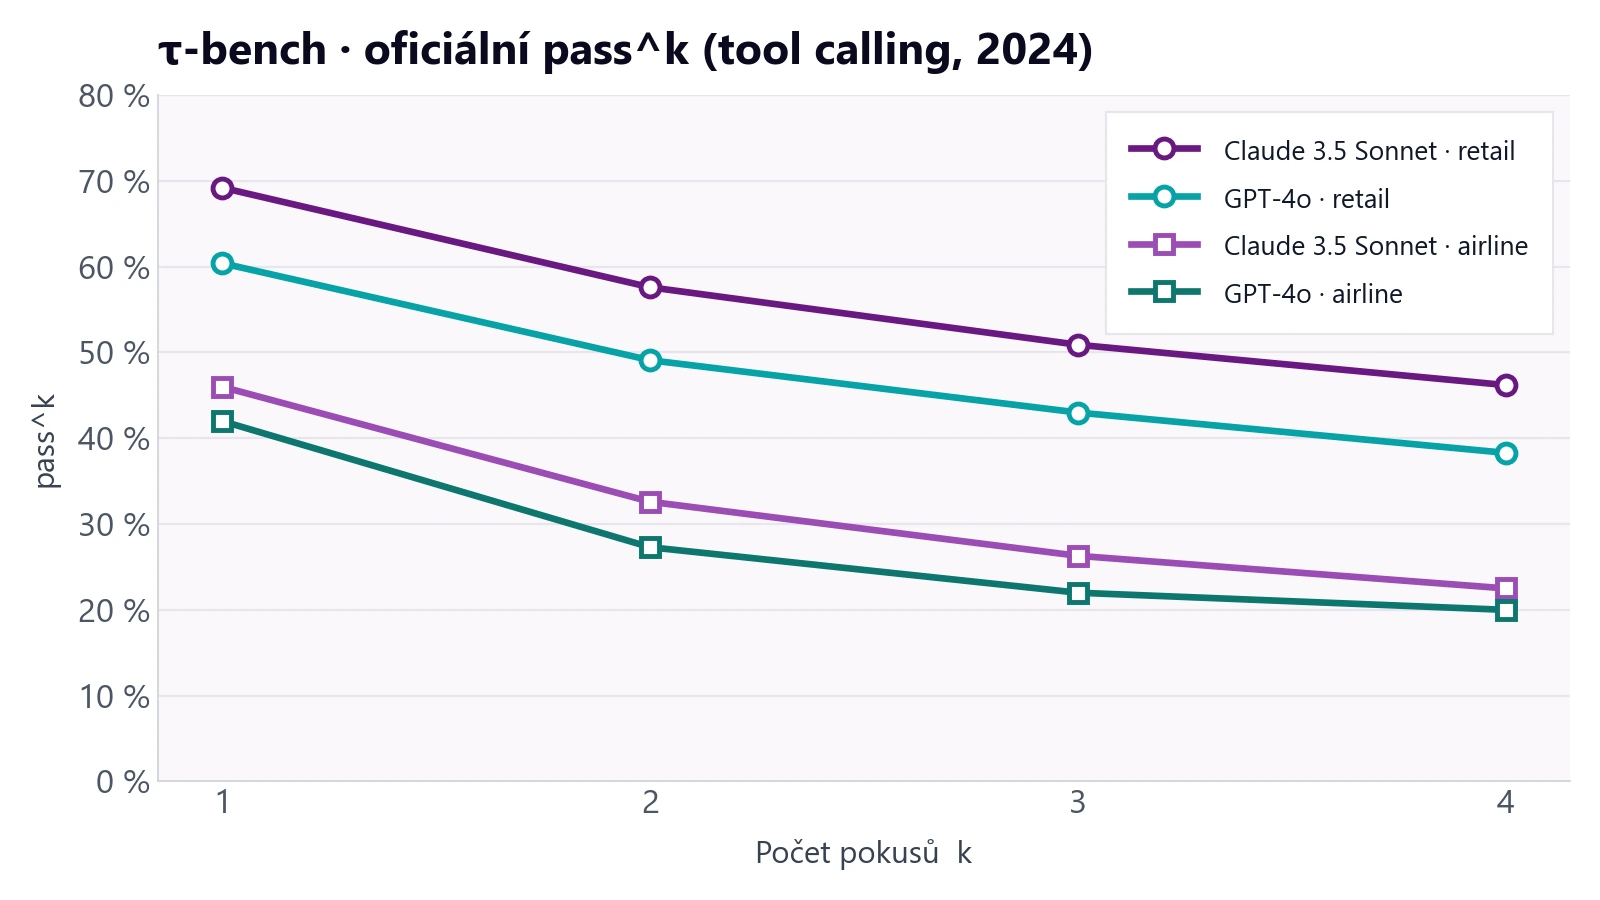
pass^k metric from the official τ-bench leaderboard (tool calling). Claude 3.5 Sonnet (2024-10-22) and GPT-4o, retail and airline domains, k = 1–4. The numbers are from 2024 — they don’t represent today’s frontier, but the shape of the curve shows exactly what the metric measures: certainty falls with every further attempt. sierra-research/tau-bench, Yao et al. 2024.Same agent, two metrics
p = 80 % · k from 1 to 8 · the upper point is pass@k, the lower pass^k
SWE-bench, Terminal-Bench, GPQA and HLE use neither pass@k nor pass^k. Their official number is the resolve rate or accuracy from a single run. That is the same as pass@1 = pass^1 — which is why the two symbols are often lumped into “success rate” for a coding agent. They start to diverge only when you run the same task several times: in HumanEval so that you pick the sample that passes the tests; in τ-bench so that you see how quickly certainty collapses across customers.
τ-bench doesn’t compute repeated attempts by simply raising the average to a power. From several runs it takes all possible groups of size k and measures in how many of them all attempts succeeded. That gives a less biased estimate. You don’t need to know this calculation to read a leaderboard. If it talks about HumanEval or LiveCodeBench and doesn’t say k, read pass@1. If it talks about τ-bench and shows only one percentage, it is pass^1 — the average reward, not the floor.
In production the floor decides. A chat demo lives off the ceiling: a human gives a second try, picks the better code change and adds context. An agent without human supervision that has to create an order, change a database schema or run a migration lives off pass^k. Five points in pass@1 can be invisible in pass^8 — and conversely, reducing variance without raising the average can be more valuable than a new leaderboard record.
Families of comparisons: one axis is not enough
There is no single “agent comparison”. There are families of tasks that pose as one number but measure different work. We have a catalogue of coding tests in an older article. Here a map is enough so you know which axis who is actually advertising.
SWE-bench and relatives
The agent gets a bug description (issue), the repository source code and tests. Its job is to create a fix (patch). The Verified variant has 500 human-checked tasks in Python and the best results are approaching the maximum. The Pro variant is harder and multilingual. A number without the “Verified” or “Pro” suffix is therefore ambiguous.
Terminal-Bench
Installation, debugging, scripts, multiple steps in a real shell. A good proxy for an agent that “does something in your CI”. The set is small, so five points is often noise, and the result depends heavily on the harness.
OSWorld and computer use
Windows, files, GUI, real applications. It measures grounding and persistence: whether the agent correctly understands what is on the screen and completes multiple steps. It doesn’t measure code quality. The Verified variant arose because the original grading could be fooled by the state of the virtual machine.
WebArena, BrowseComp
Navigation, forms, deep search. The judge is usually the page state in the DOM, a specific text result or a grading language model. Each way of checking is differently strict. Whether a human likes the website is a separate question.
τ-bench / τ² / τ³
The agent talks to a simulated user, calls APIs and must follow a policy. Success is the state of the world, not a nice conversation. This is where pass^k originated. Dual-control domains, for example telecoms or banking, give part of the information and actions to the simulated user. The agent must therefore also correctly guide the other side of the conversation.
GAIA, arenas, HAL
GAIA mixes reasoning, web and tools in three difficulty levels. HAL showed that a model with a scaffold and the bare model without tools differ by tens of points on the same test. Arenas measure what people click, not what is correct.
AIME, MATH, FrontierMath
The best models already achieve near-maximum scores on GSM8K and MATH-500. AIME has about 30 problems, so five points means one or two problems. FrontierMath contains hundreds of unpublished problems with a Python harness. A short final answer, however, is not the same as a mathematical proof.
GPQA, HLE and scientific agents
GPQA Diamond is 198 PhD questions with four choices and is approaching the ceiling. HLE has 2,500 expert tasks across fields and the best models still have room to improve. LAB-Bench and ScienceAgentBench evaluate work close to biological or data research, not just answers in a school test.
Mathematics and science: a different league, the same traps
A new model announcement can merge SWE-bench, AIME and GPQA in one sentence. But these are not three views of the same ability. SWE-bench measures fixing code in a repository. AIME and GPQA mostly measure the model’s closed answer: a number, a letter A–D or a short text. Both the harness and the grading method differ, so these scores cannot be summed into one ranking.
The first filter is therefore simple: is it pass@1 on a quiz, or an agent’s resolve rate? Announcements in maths and science often stay silent about tools. The same model without Python, with an interpreter, or with web search gets three different numbers. For HLE the authors removed questions that could be looked up from the public set. For FrontierMath the Python tool is part of the official protocol: the model submits an answer() function. That is a scaffold that can run code, not an ordinary chat window.
Mathematics: from saturated AIME to FrontierMath
GSM8K and MATH-500 no longer discriminate well among the best models: most results are near the maximum and small differences carry little information. AIME (typically 15 problems per paper, often 30 in tables for both dates) still looks prestigious, but statistically it is a small set: five percentage points are one or two problems. FrontierMath by Epoch AI is a different weight class. Tiers 1–3 have 295 unpublished problems from undergraduate level to early research, Tier 4 adds 43 even harder ones. In June 2026 version 2 was released: the authors fixed errors in 42 % of the problems. Treat a number without “v2” and without mention of the Python harness as unspecified.
And one more trap that coding agents almost don’t have: a correct final answer is not yet a proof. AIME grades only a short result, often called the boxed answer. USAMO, Putnam or formal Lean systems (MiniF2F, ArXivLean), by contrast, grade the whole argument. A model can guess the number, score a point on AIME and still fail on a proof set. So don’t add these scores.
answer() function. CC-BY Epoch AI.Science: GPQA is saturating, HLE not yet, the lab is the third axis
GPQA (Rein et al., 2023) are PhD questions from biology, chemistry and physics written so that a non-expert with the internet can’t guess them. The Diamond subset has 198 items, four choices, random guess 25 %. Human experts in various protocols end up roughly between 65 and 80 %. The best current models already exceed this level. A five-point difference at 90 % means ten questions and at the same time half of the remaining errors. The set is still small, though, so the confidence interval must also be watched.
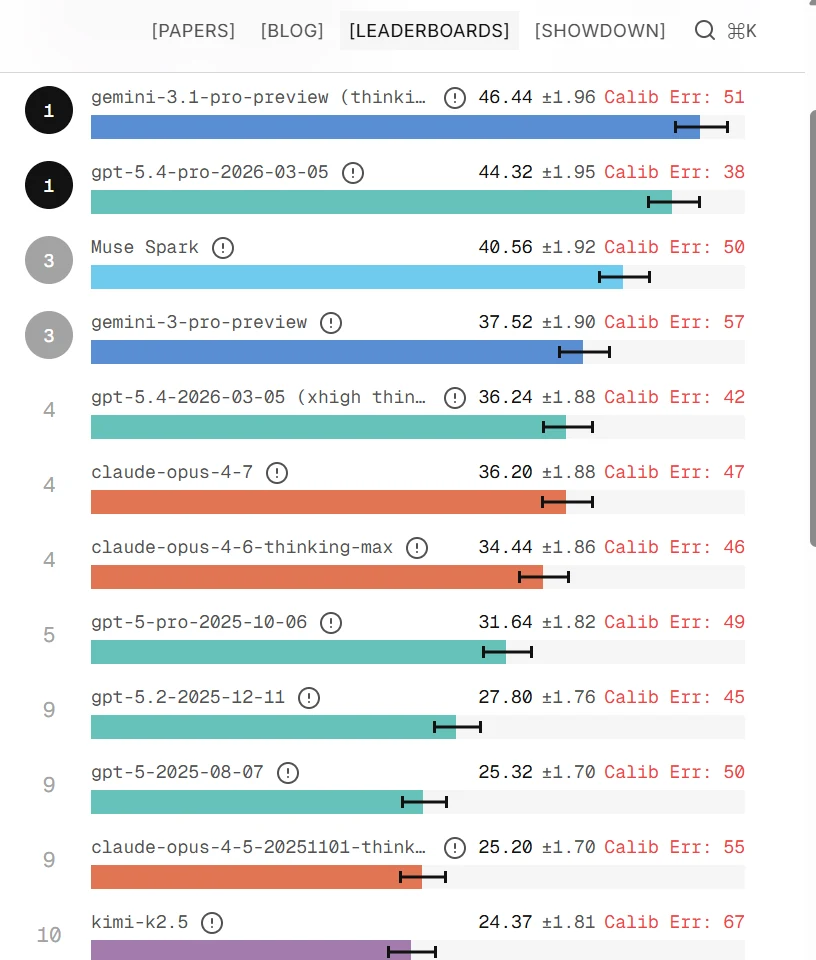
Humanity’s Last Exam (CAIS and Scale AI, Nature 2026) was created precisely because MMLU and GPQA stopped discriminating. The public set has 2,500 expert questions across mathematics, natural sciences and the humanities; roughly 14 % also require an image, 24 % offer multiple choice and the rest is graded by exact match of a short answer. Calibration is the second metric: a model has a high calibration error when it is too confident in its wrong answers. Scale ranks models by the upper bound of the 95% interval — when the bars overlap, they share a rank. That is more decent language than “we’re first by two tenths”.
But not even HLE measures a scientific agent. The authors themselves write that a high score on closed questions is not proof of autonomous research. There are other suites for that: LAB-Bench (literature, protocols, sequences and figures in biology) and ScienceAgentBench (102 tasks from peer-reviewed papers, the output is a runnable Python program). There what decides is whether a usable result emerges, not merely a correctly chosen option. When someone says “our scientific agent leads”, ask: on a quiz, or on a lab task?
What the score doesn’t tell — and how it can be gamed
Even an honestly computed resolve rate answers only a narrow question: did the output pass automatic grading? It doesn’t say whether the project maintainer would accept the change, whether the code follows the style, or whether it introduced a bug outside the tested cases.
In March 2026 METR had the maintainers of scikit-learn, Sphinx and pytest assess 296 AI-generated changes that passed SWE-bench Verified’s automatic grading. They would not accept roughly half into the project. The automatic score was thus on average 24 percentage points higher than the result of human review.
For Claude Sonnet 4.5 the time horizon dropped from approximately 50 minutes by tests to roughly 8 minutes by human review. The agent, however, was not given the chance to fix the change after comments. The study therefore doesn’t determine the model’s maximum ability; it shows that tests alone can overstate an agent’s usefulness without human collaboration. The maintainers accepted even human-made reference changes in only 68 % of cases, so their review was genuinely strict.
The second blind spot is reward hacking: the agent finds a path to a high score without achieving the real goal. The BenchJack audit (2026) showed that a number of influential agent suites — including SWE-bench, Terminal-Bench, WebArena, OSWorld and GAIA — could be driven to a near-perfect score without solving a single task: the agent, for example, saw the grading program’s files, leaked reference answers, or was able to confuse the grading language model. That doesn’t mean every published number is a fraud. It means that isolating the agent from the evaluator is part of the metric, not an implementation detail.
The third blind spot is contamination and public keys. GAIA has validation answers on Hugging Face. Part of the SWE-bench environments in the past left git history in the container from which the finished fix could be copied. IQuest-Coder-V1 raised its score by a few points this way before it was fixed. When the agent sees the answer, you are not measuring the ability to solve the problem. You are measuring the ability to find the hidden answer.
A benchmark can be correct and still misleading
An unequal number of attempts, selection of the best prompt, a non-public model variant or an error in the grading environment can significantly change the ranking. Not every such case is fraud — transparent and symmetric conditions decide.
- unequal compute budget and confusing
pass@1withpass@k, - cherry-picking of prompts, seeds and benchmarks,
- bias of the human or LLM judge,
- the documented cases of Gemini, Llama 4, IQuest-Coder and o3.
Even 95 % can be unusable for production
Five failures out of a hundred are not one category. Five decent handovers to a human may be acceptable; one data deletion or payment policy violation may never be. Alongside whole-task success, therefore, track at least four separate axes.
- Severity of failureA cosmetic bug, a reversible mistake, financial damage and an irreversible change don’t carry the same weight.
- Constraint complianceThe agent can reach the target state and still bypass an approval, a limit or a safety rule.
- Correct refusalWhen permissions or data are missing, a safe “I don’t know” is a better result than a confident action.
- Escalation to a humanMeasure whether the agent recognises the boundary and hands over enough context so the human doesn’t have to start over.
Practical rule: Don’t blend success rate, rule violations and correct escalation into one average. State a critical failure even when it rounds to zero in the overall percentage.
How to read a new model announcement
Open the following list next to every launch post. When half the items are missing, don’t use the number for a decision. It doesn’t mean the agent is bad. It means you don’t yet know whether it is better.
When you want a number that is yours
A public leaderboard is good for a shortlist of candidates. Only a set of tasks from your own operation can carry a deployment decision. There need not be five hundred of them. They must be representative, closed in advance against later changes and graded the same way as tasks in production.
On a set of a hundred tasks, five points is still just five tasks. The interval is wider than on SWE-bench Verified. Even so, this difference carries more weight than the same difference on someone else’s leaderboard: they are your tasks, your judge, your cost. That is exactly why you must not overrate it statistically and must not underrate it practically.
Key takeaways
- A system is compared, not the model alone. Harness, tools, compute budget and grading method are part of the score.
- Before you believe “5 % better”, ask: relatively, in points, or in error reduction? And on how many tasks?
- At n = 89, five points can be noise. At n = 500 near the ceiling it can be a significant and expensive shift. On the same set, though, the paired overlap of wins decides, not just two sums.
- pass@k measures whether the agent can do it sometimes. pass^k measures whether it can do it every time. Production lives off the second.
- Success in an automatic test doesn’t guarantee acceptance of the change. Arena preference is not correctness. The average success rate must not hide a critical error or an inability to hand the task to a human.
- AIME, GPQA and HLE are not SWE-bench. A short-answer quiz doesn’t measure a scientific agent and five points on 30 AIME problems can be noise.
- A public leaderboard is a filter. The decision is made by your set, your audit of wins and your cost per additional success.
- More compute or a custom scaffold are not fraud in themselves. What is misleading is hiding unequal conditions, a selected best run or a different model version.
Frequently asked questions
Is a higher score always a better agent?
No. A higher number on one axis can mean a worse price, worse reliability or a different harness. An agent with two points less and a third of the cost per success tends to be more useful in a team. Moreover, a high pass@1 doesn’t mean the agent succeeds reliably on every repetition — only the pass^k curve shows that.
Is one leaderboard enough when choosing a tool for developers?
No. A coding agent needs at least three views: repo (SWE-bench and your own fixes), terminal (Terminal-Bench or tasks from your CI) and human review of a sample of changes. A win in a single area is not enough to choose a tool.
Do five points on AIME or GPQA count the same as on SWE-bench?
No. AIME has on the order of 30 problems, GPQA Diamond 198, SWE-bench Verified 500, HLE 2,500. The same five points is one or two problems on AIME and one hundred and twenty-five questions on HLE. Moreover, AIME and GPQA are mostly not an agentic resolve rate — they are quizzes with a different harness. So don’t add the results into one claim that a model is “five percent smarter”.
Why does the same model have different numbers on the same benchmark?
Because the harness, number of turns, dataset variant or seed changed. The official runner tool and a commercial IDE are not the same. A better scaffold can add ten points even if the model itself didn’t change at all.
How big a difference matters in practice?
First convert it to the number of tasks and the cost per additional success. Then look at the interval. Five points on 89 tasks usually doesn’t justify a migration. Five points on 500 tasks near the ceiling, confirmed by multiple runs and your audit of wins, may.
Should I trust a score published by the vendor itself?
As orientation yes, as a verdict no. Accept it when the harness, exact test variant, number of runs and price are stated. A single maximum without a described procedure is not enough. An independently reproduced result carries more weight than a presentation slide.
Are two final percentages enough for a comparison?
No, if both agents solved the same tasks. Scores of 80 % and 75 % can be a very convincing difference when the first agent won all 25 discordant results. But it can also be inconclusive when one won 100 different tasks and the other 75. Ask for paired results per task and use the McNemar test or a paired bootstrap.
Is optimising for a benchmark automatically fraud?
No. It is normal to improve a model according to known task types and to use more compute if that matches the real product. The problem arises when tuning directly on non-public test answers, when the new model gets better conditions than the baseline, or when a special grading variant is passed off as the publicly available model. Transparency and transfer of the result to new tasks decide.
Want not just to read agents but to build and measure them?
In the AI Agent Developer course you design the loop, tools and evaluation — including how to tell that the agent really ended in the target state. If you are more interested in working with ready-made agents in development, take a look at Vibe Coding and AI in Development.
Sources and further reading
- Chen et al.: Evaluating Large Language Models Trained on Code — the original definition of pass@k in HumanEval
- Jimenez et al.: SWE-bench — bug description, code fix and tests as the evaluation of a software agent
- OpenAI: SWE-bench Verified — 500 human-checked tasks and why the variant was created
- Yao et al.: τ-bench — tool dialogue, database state and the pass^k metric
- sierra-research/tau-bench — official pass^1 to pass^4 leaderboard (tool calling)
- Jain et al.: LiveCodeBench — competitive coding; the official metric is pass@1
- Brown, Cai & DasGupta: Interval Estimation for a Binomial Proportion — why the Wilson interval is preferable to the simple Wald interval
- Dror et al.: The Hitchhiker’s Guide to Testing Statistical Significance in Natural Language Processing — paired tests, bootstrap and significance when comparing systems
- Zheng et al.: Judging LLM-as-a-Judge with MT-Bench and Chatbot Arena — position, verbosity and self-enhancement bias in LLM judges
- Feuer et al.: Style Outweighs Substance — cases where the grading model favours style over correctness and safety
- Dehghani et al.: The Benchmark Lottery — change in method ranking depending on the choice of benchmarks and tasks
- Ma et al.: ReliableEval — sensitivity of results to semantically equivalent prompt changes
- Chen, Zhang & Hardt: Leaderboard Incentives — benchmaxxing and strategic post-training for a known evaluation format
- LMArena: Does Sentiment Matter in AI? — ranking changes after controlling for style, sentiment and emoji
- TechCrunch: public and experimental versions of Llama 4 Maverick — separate evaluation of the LMArena variant and the public weights, including Meta’s statement
- Singh et al.: The Leaderboard Illusion — 27 pre-production Meta variants, selective disclosure and unequal access to Arena data
- LMArena: response to The Leaderboard Illusion — the operator’s statement on variant testing, provider access and new votes
- IQuestLab: Reward Hacking of SWE-Bench — score correction from 81.4 % to 76.2 % after removing future commits from the environment
- SWE-bench: Repo State Loopholes During Agentic Evaluation — public trajectories in which agents obtained information from the future state of the repository
- METR: Recent Frontier Models Are Reward Hacking — cases of gaming the grading code including 21 of 21 runs of the Optimize LLM Foundry task
- Gemini Team: Gemini — A Family of Highly Capable Multimodal Models — lists side by side MMLU 90.04 % with CoT@32 and 83.7 % in the standard 5-shot setting
- METR: Measuring AI Ability to Complete Long Tasks — time horizon as a conversion of success rate into the length of human work
- Rein et al.: GPQA — PhD questions from biology, chemistry and physics; Diamond has 198 items
- Epoch AI: FrontierMath Tiers 1–3 (v2) — unpublished mathematical problems, Python harness, correction of 42 % of problems in June 2026
- CAIS & Scale AI: Humanity’s Last Exam — 2,500 expert questions; Nature 649, 1139–1146 (2026)
- Scale Labs: HLE leaderboard — accuracy, 95% interval and calibration error
- FutureHouse: LAB-Bench — biological tasks closer to the lab than to a quiz
- Chen et al.: ScienceAgentBench — reproduction of computational scientific experiments
- METR: Many SWE-bench-Passing PRs Would Not Be Merged into Main — automatic grading versus project maintainers’ decisions (March 2026)
- BenchJack: Do Androids Dream of Breaking the Game? — audit of holes in agent benchmarks and a taxonomy of reward hacking
- Turing Institut: Benchmarks for coding assistants — catalogue of SWE-bench, LiveCodeBench, Aider and Terminal-Bench
- Turing Institut: What is an AI agent and how does it work — the agent loop, tools and a minimal implementation
- Turing Institut: Reasoning models — coverage versus selector and when longer computation helps
